We solve previous statistics exercise
Solution:
1) Representation of scatter plot Mi (xi;yi) accompanied by the statistical series in an orthogonal coordinate system:
(On the abscissa axis, 2 cm represents one year, and on the ordinate axis, 1 cm represents 100 tons of fish)
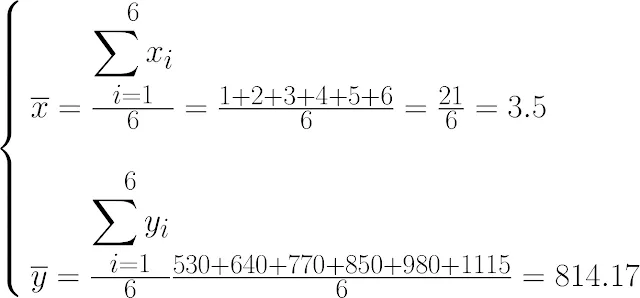
2) Determining the coordinates of the centroid point G for this scatter plot.
We have: G (x̄;ȳ), where:
And from it: G(3.5;814.17).
3) Demonstrate that the least squares regression line equation is y=115x+411.67.
The equation of the regression line is of the form y=ax+b where:
and b= ȳ-ax̄ (Because G belongs to this line)
To calculate a, we use the following table:
By substituting, we find:
a=(19110 6 )−(3.5×814.17)17.56
a≃ 115
And we have: b= ȳ-ax̄ =814.17-115(3.5)=411.67
Then: y=115x+411.67
4) Determining the production of this water reservoir in the year 2015. (All results are given rounded to 10-2).
We have: The order of the year 2015 is x=2015-2004+1=12
Then: For x=12, we find y= 115 (12) +411.67=1791.67
The production of this water reservoir in the year 2015 is 1791.67 tons.


